您使用提示模式 关闭
来自 Cbonds Equity 和 BondMap 的小工具
Cbonds 团队为发行商提供在其网站上放置小工具的服务,这些小工具以图形方式显示股票和债券等金融工具的信息。公司有两个主要发展方向:债券地图小工具(债券小工具)和股票小工具(股票小工具)。
小装饰
免费
- 可选择债券类型和货币
- 包含主要结算指标的债券地图
-
根据您的喜好调整小工具的样式
每日更新的小工具,包含债券和欧洲债券发行地图及其分析指标:收益率和期限。
股票小装饰:股票部件
免费
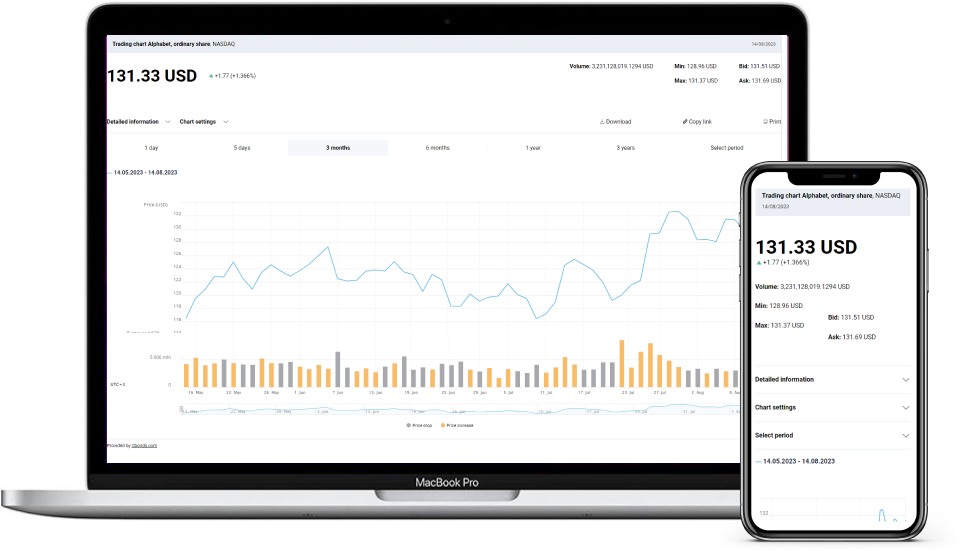
以图表形式显示所选期间的股价动态,与主要指数的动态进行比较,并将获得的信息上传到 Excel 中。
- 股票发行的详细信息
- 可选择交易大厅
- 4 种带有周期变化的图表类型
股票小装饰:历史报价
显示股价变化、最高价和最低价以及交易量等信息
- 开盘价和收盘价的历史数据
- 选定时期的交易量信息
- 比较不同交易平台的股价动态
股票小装饰:投资者计算器
按投资金额或购买股数显示投资价值的动态变化信息
- 计算投资金额的财务结果
- 更改参数
- 便捷的图形显示
我们的小工具适用于任何设备

我们在您的资源上使用简单的独立嵌入代码
                <
                iframe
                src = "链接自动生成"
                border = "0"
                frameborder = "0"
                allowtransparency = "true"
                framespacing = "0"
                allow = "clipboard-write"
                framespacing = "0"
                allow = "clipboard-write"
                height = ""
                ></
                iframe
                >
嵌入代码示例
你必须 注册 才能获得访问权
 widget@cbonds.info

